A Timeline Report is a (graphical) representation of information in relation to time and can be used to report on all types of entries. Timeline reports are based on timeline views. Timeline views work differently compared to normal views and function a bit like pivot tables known from Excel. Timeline reports can, for example, be used to compare your available resource capacity with your requested and allocated resource availability. It can also be used to compare the budget and actual costs within a project. Timeline views can be used on screen and in Automated Reports (see Creating an Automated Report in Excel). The section Timeline Reports can be found below the section Reports on Dashboards and/or the tab Reports.
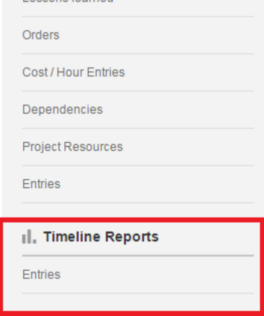
The section Timeline Reports
Working with timeline views is in many ways exactly the same as working with views. The main difference is in how to define the view. For that purpose timeline views have a extra menu option: Basic Settings.
Create a timeline report
This example describes how to create a table with costs per product per month for this year within a project.
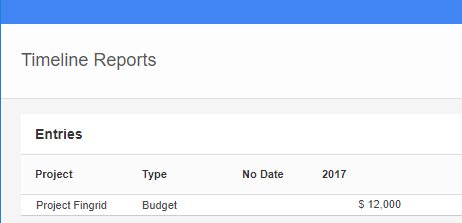
Step 1. Navigate to your project, to the tab Reports, to the section Timeline Reports, and click Entries, a pop-up appears
Step 2. In the pop-up click View, then click Basic Settings, the pop-up Timeline Report Configuration appears.
Step 3. First fill in the top section of the pop-up:
•Unit: select Money (changes on book date).
•Scale: set scale to Years to show the costs per month.
•Start date: select This year as a dynamic start date.
•Horizon: enter 1 to make sure the report will cover the whole year.
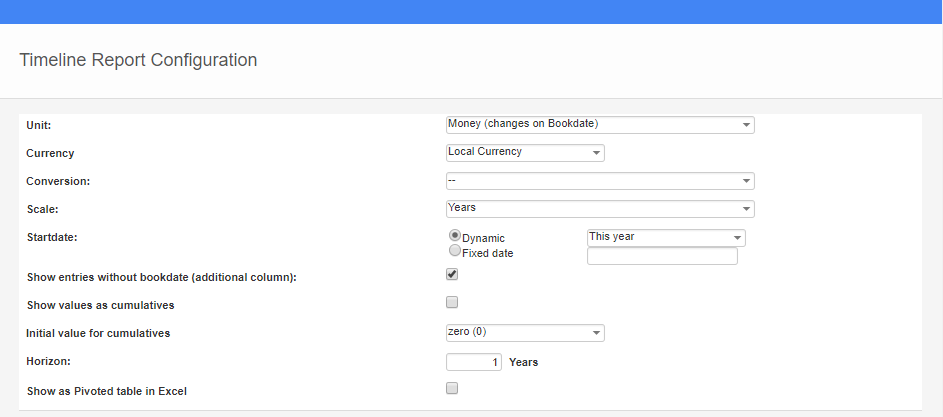
The pop-up Timeline Report Configuration, top section
Step 4. Next fill in the section Apply filter on entries: in the filter Type, select Budget and Actual.
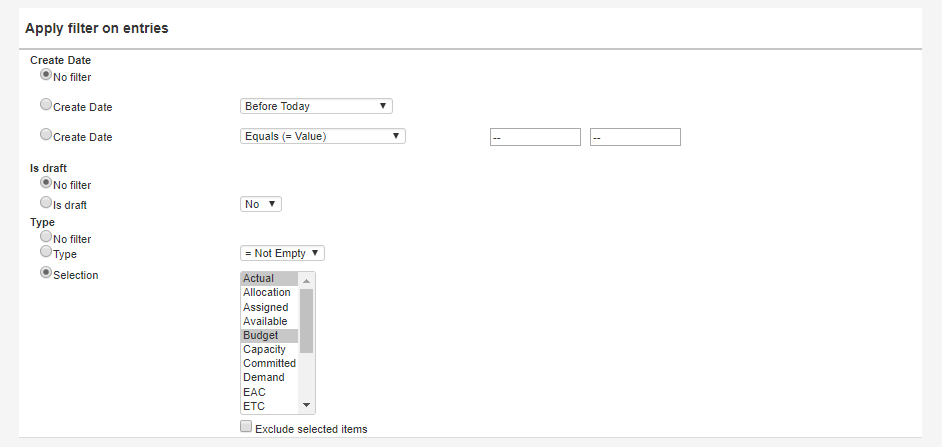
The pop-up Timeline Report Configuration, section Apply filter on entries
Step 5. Next fill the section Timeline representation: select the representation type Table, and in the Table configuration select the fields Product and Type.
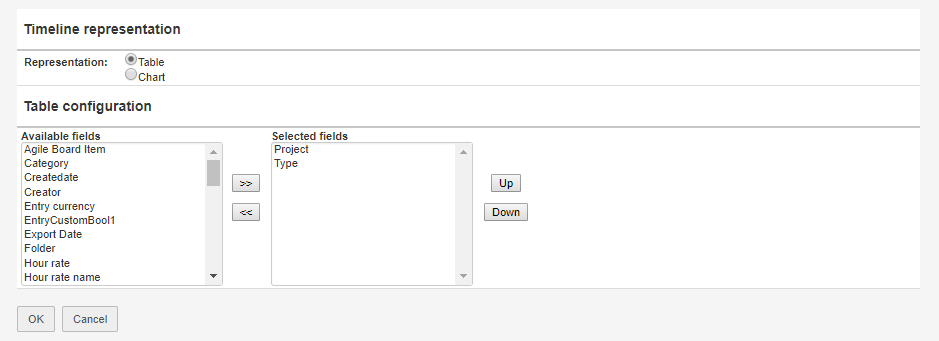
The pop-up Timeline Report Configuration, section Timeline representation and Table configuration
Step 6. Finally click OK and view the result on your screen.
Note: If you work in a configuration with multi-currency, a timeline view will show results in the currency of the Organisational Unit where you use the view. In the screenshot below you can see that a budget in $ is shown in € in the timeline view.