Depending on your role you can create Automated Reports in Fortes Change Cloud.
Before you build a report, please consider the following questions:
•What is the purpose of the report?
•Who will use the report and what decisions should be made with the report?
•What kind of report is it: a portfolio report, a project report, a resource pool report, other? The answer determines on which location you should start.
•What is the content of the report? What information do you need from Fortes Change Cloud?
•On which objects does that data exist?
Creating an Automated Report in Excel
Excel reports are more commonly used then Word reports because Excel has a lot of features to edit and display data.
Step 1. Understand the report to build: which data from Fortes Change Cloud is needed?
Step 2. In Fortes Change Cloud, define the views required for the report. See Working with views.
Note: in Automated Reports you can only use views made in the section Reports; you cannot use views made in Dashboards.
Note: start the name of views with "AR" to indicate that a view is used for an Automated Report; this as a signal that these views should not be changed.
Step 3. Navigate to the location where you want to create the report, navigate to the section Automated Reports, click on ![]() , a dialogue box appears:
, a dialogue box appears:
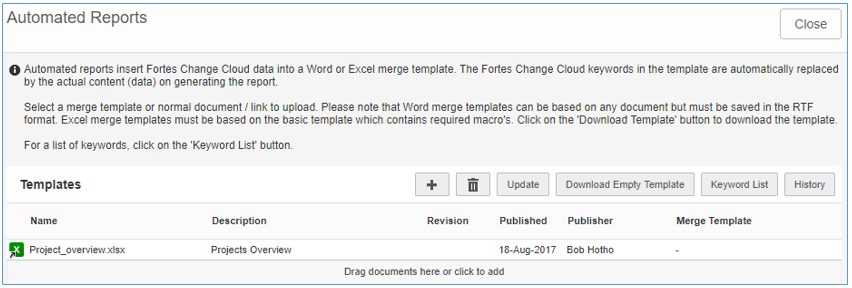
Dialogue box Edit Automated Reports
Step 4. In the dialogue box, click Download Empty Template, open the Excel template and allow macros, Excel will now display an additional tab PTB:
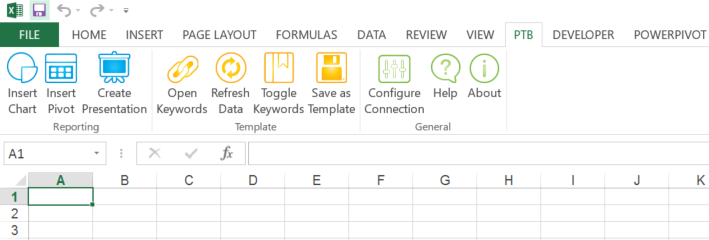
Extra tab PTB in the Excel template
Step 5. Next, add Fortes Change Cloud fields and views to the Excel template:
•In the Excel tab PTB click Open Keywords, a new tab with keywords opens in your web browser. Or: In the section Automated Reports click ![]() , a dialogue box appears, click Keyword List, a dialogue box with keywords appears.
, a dialogue box appears, click Keyword List, a dialogue box with keywords appears.
Note: the keywords screen has two tabs: one for fields and one for views.
•Click on a keyword and drag it to Excel. Or: use your right mouse button to copy and paste.
Note: a field appears as a cell, a view appears as a table with a header.
Step 6. Format the fields and tables in Excel and format the report:
•Fields: can be formatted directly.
•Table headers: can be formatted directly.
•Table body: can only be formatted in the first empty row below the table.
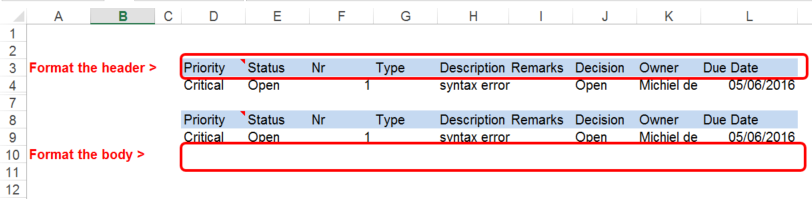
Difference between formatting the table header and formatting the table body
Note: in the Excel tab PTB you can click Refresh Data to check whether the body formatting is applied correctly to the entire table.
Step 7. When the automated report is ready, in the Excel tab PTB click Save as Template, a dialogue box appears. Enter the dialogue box and click OK to save the Automated Report.
Step 8. Finally, upload the Automated report in Fortes Change Cloud. Navigate to the location where you want to add the report, navigate to the section Automated Reports, click ![]() , a dialogue box appears. Click
, a dialogue box appears. Click ![]() , a dialogue box appears:
, a dialogue box appears:
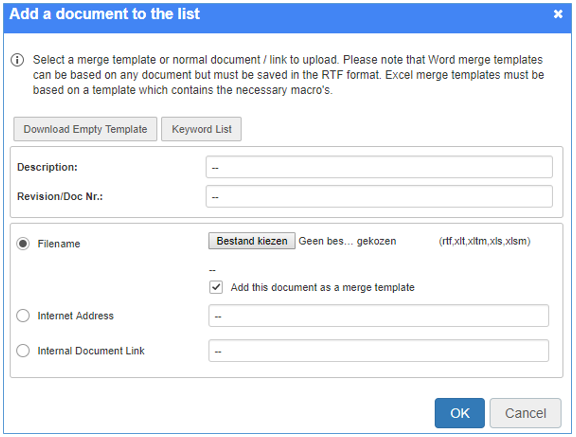
Dialogue Add an Automated Report
Step 9. Click Choose File to select the saved report, enter the Description (this will be the display name of the report), make sure that the box Add this document as a merge template is checked, and click OK. The Automated Report is now ready for use.
Editing an Automated Report in Excel: on using Excel functions
In Excel you can perform all kinds of operations on the data from Fortes Change Cloud. Below you find some examples and considerations when working with tables.
Add a formula in a row
Step 1. Add a new column before or behind the columns in the view. In the example below the column Total is added - it is not part of the view.
Step 2. Place the formula in the new column in the first empty row below the table.
Step 3. Click Refresh Data to apply the formula to the entire table.
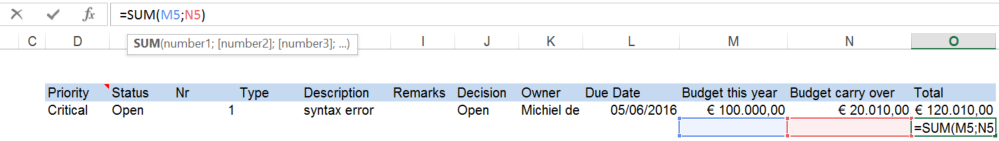
Applying a formula in the first empty row under the view
Add a formula to a column
Step 1. Place the formula in the row below the first empty row below the table.
Step 2. Please note that the formula must also include the table header in order to work correctly!
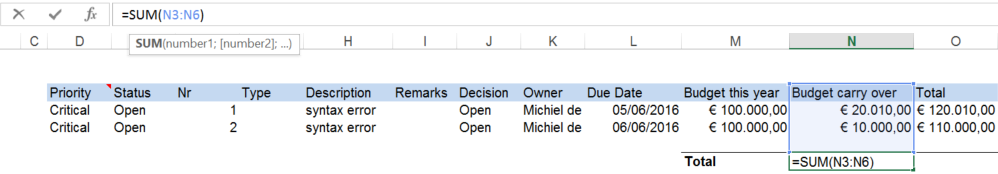
Applying a formula to a column: the formula must also include the table header
Using conditional formatting in views/tables
Using conditional formatting on views/tables works the same as applying regular formatting on tables: add the conditional formatting in the first empty line below the table. Click Refresh data to check the conditional formatting on the entire table.
Using pivot tables
When using pivot tables make sure to include the first empty row below the table in the range!
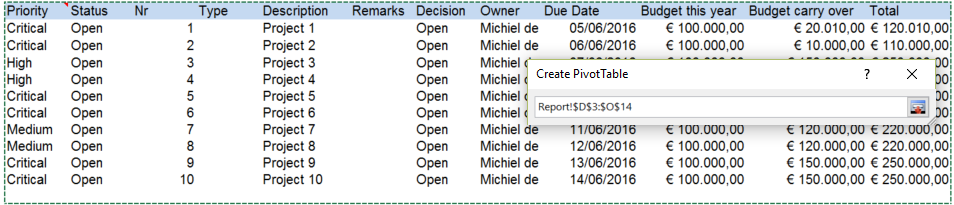
Selecting the range for a Pivot Table: always include the header and the first empty row below the table
Working with Rich Text fields from Fortes Change Cloud
Fortes Change Cloud supports custom fields of the type Rich Text (Memo field with additional formatting). When you use such fields in Automated Reports in Excel, not all formatting is transferred:
•Bold, italic, underline, font colour, font size and line breaks are maintained.
Note: Shift-enter (line break) and Enter (paragraph) both show as a line break.
•All bullet lists are shown as '-'
•Background colour and horizontal lines are not maintained.
•Note: In Automatic Excel Reports you must apply Wrap Text to the appropriate cell for the formatting to be maintained. If not, all formatting is lost.