In a portfolio on the tab Dashboard Report, you can freely use widgets to visualise the portfolio in many ways. The resulting dashboard can be used for monitoring the portfolio and can be shared with stakeholders via the Fortes App (see Send the Dashboard Report to mobile devices of Stakeholders).
Create a Dashboard Report
Step 1. Navigate to a portfolio, to the tab Dashboard Report.
Step 2. Click ![]() and then
and then ![]() to add widgets.
to add widgets.
Step 3. Click Choose your widget to determine each widget.
Step 4. Per widget click Configure to configure the widget. See Working with Widgets.
Step 5. Drag, drop and re-size the widgets on the page.
Step 6. When you're finished, Click Save.
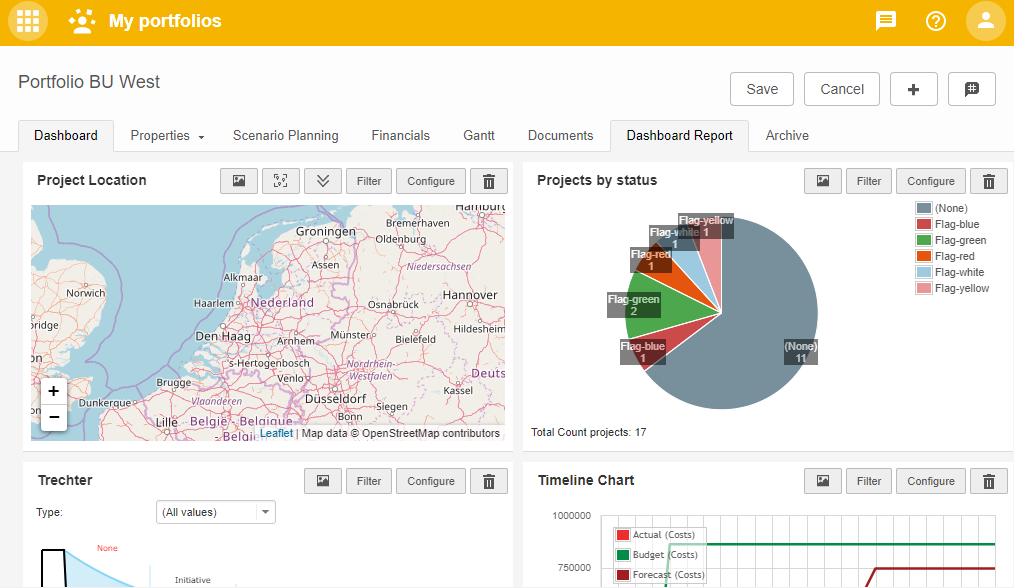
The tab Dashboard Report