Fortes Change Cloud supports a variety of ways to present data, ranging from on screen lists, to on screen visuals, to tailor made reports in Excel or Word.
Views basically are tables showing a set of fields on a list of items. Views can be found and used throughout Fortes Change Cloud, e.g. on your Home Page, in Dashboards, in Folders, in Logs, and in the section Reports.
You can use views in many ways:
•Use (predefined) views for on screen reporting and in-view-editing. See Use Views to View or Edit data.
•Create views for ad hoc on screen reporting. See Create a View: set columns, and Create a View: set a filter.
•Save views for re-use by you, or for e.g. every team member in your project. See Save a View for re-use.
•Quickly export a view to Excel, Word or the Clipboard. See Quickly export a View Excel, Word or Clipboard.
Clicking on the View-name shows a drop-down list of available (predefined) views:
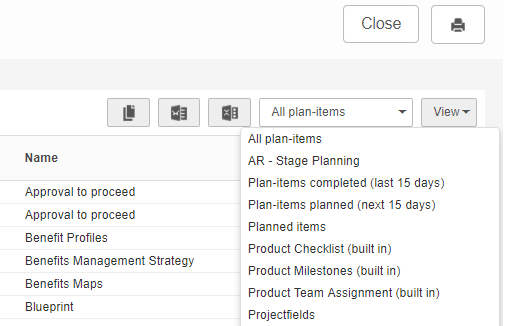
Drop-down list of available views
Clicking on View shows an options menu:
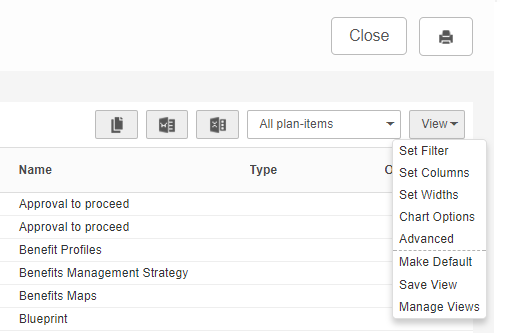
Drop-down list of view options
The view options are:
| Set Filter | : define a filter for the view, see Create a view: set a filter. |
| Set Columns | : define the columns in the view, see Create a view: set columns. |
| Set Widths | : change the column widths; drag the line between columns to increase or decrease the column size. |
| Chart Options | : show the view as a chart. |
| Advanced | : extra settings (e.g. show column totals) |
| Make Default | : make a view your personal default view; it will be shown when opening this tab. |
| Save View | : save the view, see Save a view for re-use. |
| Manage Views | : manage the properties of all views available on this location, see Managing views. |