Note: Where you can enter which costs depends on your configuration.
The financial administration of projects and programs forms the basis for the steering of projects, programs and portfolios on money. In Fortes Change Cloud the ‘financial grid’ forms the foundation for monitoring of reservations, budgets, actuals and forecasts of projects.
The report cycle between projects, programs and portfolios is used to exchange financial information. This process is configurable in multiple ways. A common scenario is:
•Releasing budgets from the portfolio to projects or programs.
•Import the actual project costs from a financial system (possibly partially from the module time entry).
•Report of forecasts per project or program to the portfolio
Every portfolio and project has a tab Financials. This gives an overview of the financials of the projects or programs in the portfolio: the financial grid. The grid displays budgets, actuals, etc. per financial period (year, quarter or month). In a project the financial grid is available on the tab Financials.
The financial grid is divided in three periods:
•Everything prior to the current financial period
•The current financial period
•Everything following the current financial period
These types of information are standard in Fortes Change Cloud:
•Actuals: Actual is used for realised costs. Data can be entered into this column in multiple ways:
oManually.
oImported from a financial system.
oBased on the module Time Entry (in Fortes Change Cloud you can link a rate to resources which enables you to translate actual hours into actual costs).
•Forecast: Forecast is used for the expected costs of ongoing projects or programs. The Forecast is often entered by the project manager (in the portfolio report) and displayed in the portfolio.
The project or program manager gives a forecast for the current and the following financial periods. There are three settings possible for entering the forecast for the current period:
oForecast for the remaining costs of this year,
oForecast for remaining costs per month,
oForecast for the total costs during the current year.
Note: Remaining costs are the expected costs from the Forecast start date to the end of the current financial period. The forecast start date is determined automatically when a report request is send from the portfolio and can be edited manually.
Note: Ideas do not have a project manager. The portfolio manager can enter forecasts on the portfolio side, enabling him to compare the total forecast with the total reserved.
•Committed: A committed cost is an investment that a business entity has already made and cannot recover by any means, as well as obligations already made that the business cannot get out of. The column Committed is used to capture the commitments made for ongoing projects and programs. Commitments are mostly imported from the financial system but can also be entered manually.
•Reserved: The column Reserved is used for budget that has not been released yet. This column is often entered by the portfolio manager. From the reservation, the budget can be gradually released to the project or program manager. The column Reserved can also be used to enter reservations for the initiatives of the following year. During the year you can compare actuals and forecasts to the reservations.
•Budget: The column Budget is used for the approved project or program budget. The budget is often entered in the portfolio and is visible for the project or program manager. You can also use the column Budget to ’release’ the budget per stage.
•Estimate: The column Estimate displays the result of the following calculation; Estimate = Actual + Forecast for the current financial period.
•EAC: The column EAC shows the result of the following calculation: EAC = {sum of all costs before the forecast start date} + {sum of all forecasts after the forecast start date}.
Note: The EAC calculation neglects costs with a booking date at or after the forecast date.
Note: The Forecast start date can differ per project and is dependent on the last published report request. The content of the columns Variance and EAC is based on the Forecast start date of the project or programme itself.
You can adjust the availability and behaviour of the columns in the financial grid. You can also set the timescales of the previous, current and upcoming financial periods and adjust which financial categories can be used.
•The column Variance shows the remaining budget based on the following calculation: Variance = Budget – EAC.
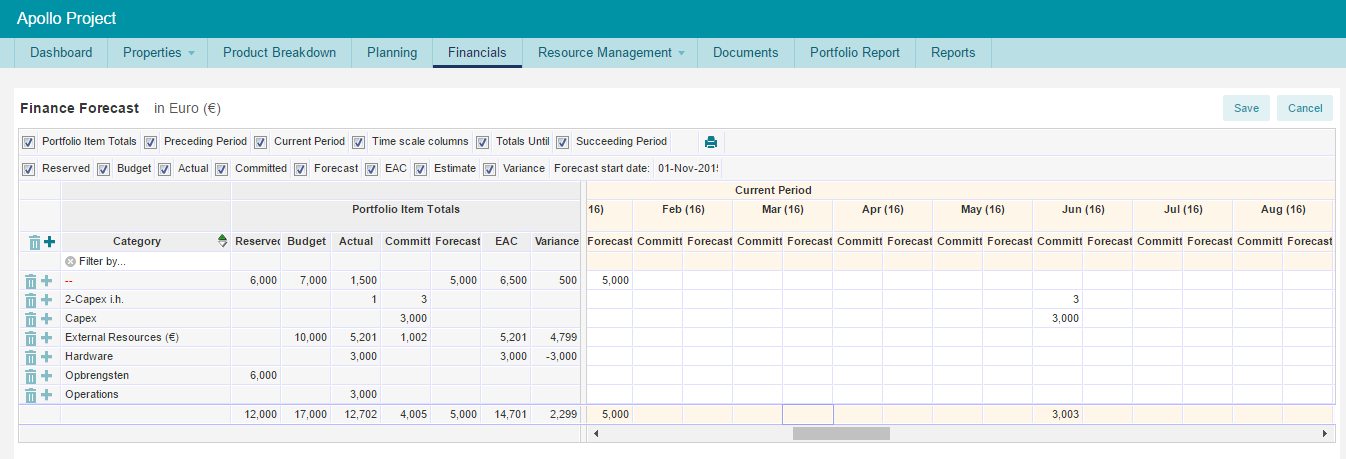
Example Financial Grid
In the financial grid you can display the project or program financials using financial categories (for example CAPEX, OPEX, hardware, software, etc.)
Click Edit (top right) and click the ‘+’-sign in front of the project or programme name to add financial categories to a project. With the ![]() sign they can be deleted.
sign they can be deleted.